
Stop overpaying on Amazon with new hidden feature that reveals past prices


Most people turn to Amazon these days when buying their favorite items, yet few are aware of a new tool implemented by the shopping giant that lets you view any products price history, helping you avoid any instances of overspending.
With sales on all the time and prices constantly changing with demand, it can be easy to find yourself overpaying — and most of the time you're not even aware that you're doing it.
Previously the only way to find out an item's historical prices on Amazon was to install a third-party extension, which in turn was only visible when shopping on the website and not through the app on your iPhone or Android device.
When going onto any product page on Amazon now, however, you'll be greeted with the option to view up to 12 months of historical prices, letting you know whether the deal you're looking at is actually good, whether it's either been cheaper in the past, or a pseudo sale that's always active.
Amazon adds native price history tracking
As shared by MakeUseOf, the new price tracking tool is available for Amazon users in the United States, Canada, United Kingdom, and India, with more countries reportedly being added in the near future.
Advert
Using Amazon's AI tools, the tool lets you view a line chart of any item's price history with intervals a month, three months, or a year for the level of specificity that you want.

You can also use the tool to set price alerts to find out when an item you want is at the price you're willing to pay, alongside comparing it with similar items and an option to 'find better value alternatives'.
Tools like this are incredibly useful when sales come around, as we've all wasted money and fallen into the trap of impulse purchasing something simply because the price looks too good to ignore.
That might sometimes turn out to be the case, but often you'll find that the product is regularly listed as low as it is in the sale, letting you maybe think twice about whether now is really the right time to buy.
How to view price history on Amazon
Viewing any products price history is made super easy, and the simplest way to check it out is to click on the 'Price history' button next to the price, as this takes you to a chat page where you'll be given the aforementioned charts to look through.
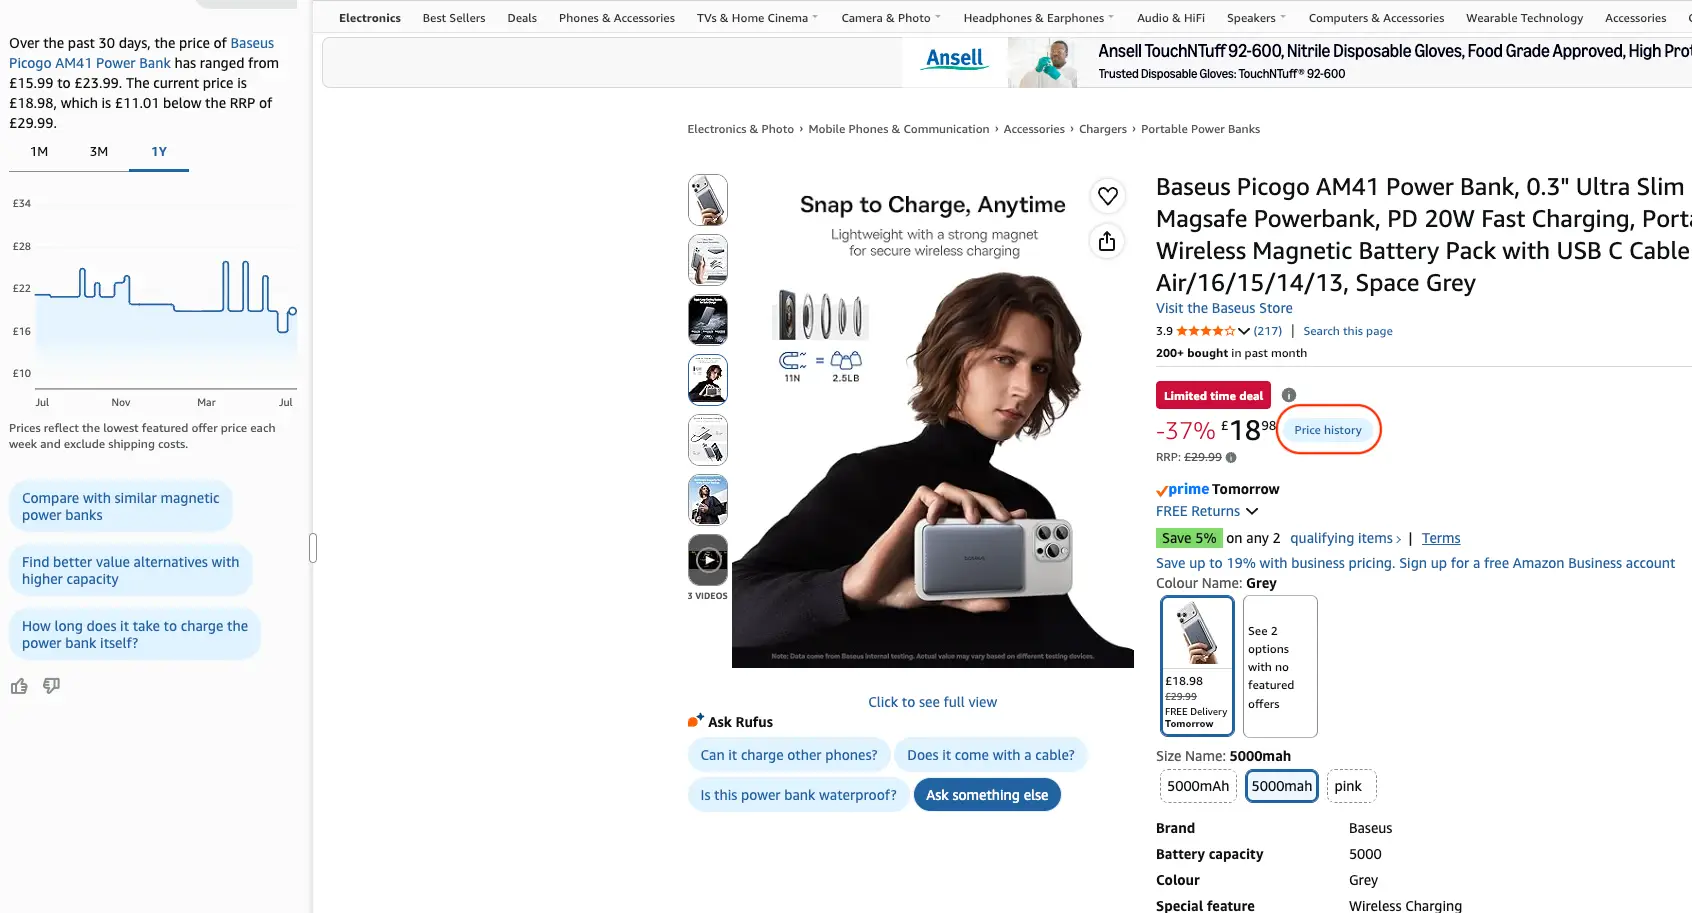
Sometimes the prompt will appear at the bottom of the page when you first click on an item using the app, but the price history button will always be there when you need it.
Unfortunately you're not able to interact with the charts to see specific prices at specific times – which can be helpful for figuring out exactly when sales start on a regular basis – but the AI chatbot does show you the price ranges for the last 30 days in a message, letting you know the highest, lowest, and current price for the item to inform your purchase.